PhONA: Phenotype-OTU based Network Analyses
Ravin Poudel
2021-08-24
PhONA.RmdIntroduction
PhONA provides a framework to select a testable and manageable number of OTUs to support microbiome-based agriculture.
## Loading required package: usethis
devtools::install_github("ravinpoudel/PhONA", build_vignettes = TRUE, force = TRUE)## Downloading GitHub repo ravinpoudel/PhONA@HEAD## Error in utils::download.file(url, path, method = method, quiet = quiet, :
## download from 'https://api.github.com/repos/ravinpoudel/PhONA/tarball/HEAD' failed
# Browse Vignettes to see the output as below.

browseVignettes("PhONA")
## No vignettes found by browseVignettes("PhONA")
###### Load the data
phyobj <- readRDS(system.file("extdata", "physeqobject.rds", package = "PhONA"))
sparcc.cor <- read.delim(system.file("extdata", "cor_sparcc.out", package = "PhONA"), sep = "\t", header = T, row.names = 1)
sparcc.pval <- read.delim(system.file("extdata", "pvals.txt", package = "PhONA"), sep = "\t", header = T, row.names = 1)
## Assign color to the taxa on the whole phyloseq object so that the same color is assigned for a taxon across treatments
phyobj = taxacolor(phyobj = phyobj, coloredby = "Phylum")
example_lm <- PhONA(
  physeqobj = phyobj,
  cordata = sparcc.cor,
  pdata = sparcc.pval,
  model = "lm",
  iters=1,
  OTU_OTU_pvalue = 0.05,
  OTU_OTU_rvalue = 0.5,
  OTU_Phenotype_pvalue = 0.6,
  definePhenotype = "Marketable",
  defineTreatment = "Maxifort",
  PhenoNodecolor = "yellow",
  PhenoNodesize = 20,
  PhenoNodelabel = "Yield",
  nodesize = 10,
  Pheno2OTUedgecolor = "black",
  netlayout = layout.fruchterman.reingold
)
## Total number of iterations used: 1
Summary of the graph
kable(summarizePhONA(example_lm$phona_graph, example_lm$roles))| node | edge | nodeDegree | avgpath | trans | mod | connectance | wtc | nModules.SA | top3hub | top3hubv | n_postiveL | n_negativeL |
|---|---|---|---|---|---|---|---|---|---|---|---|---|
| 235 | 1019 | 4.336 | 1.963 | 0.773 | 0.314 | 0.018 | 30 | 6 | 1;17;36 | 1;0.578;0.56 | 496 | 289 |
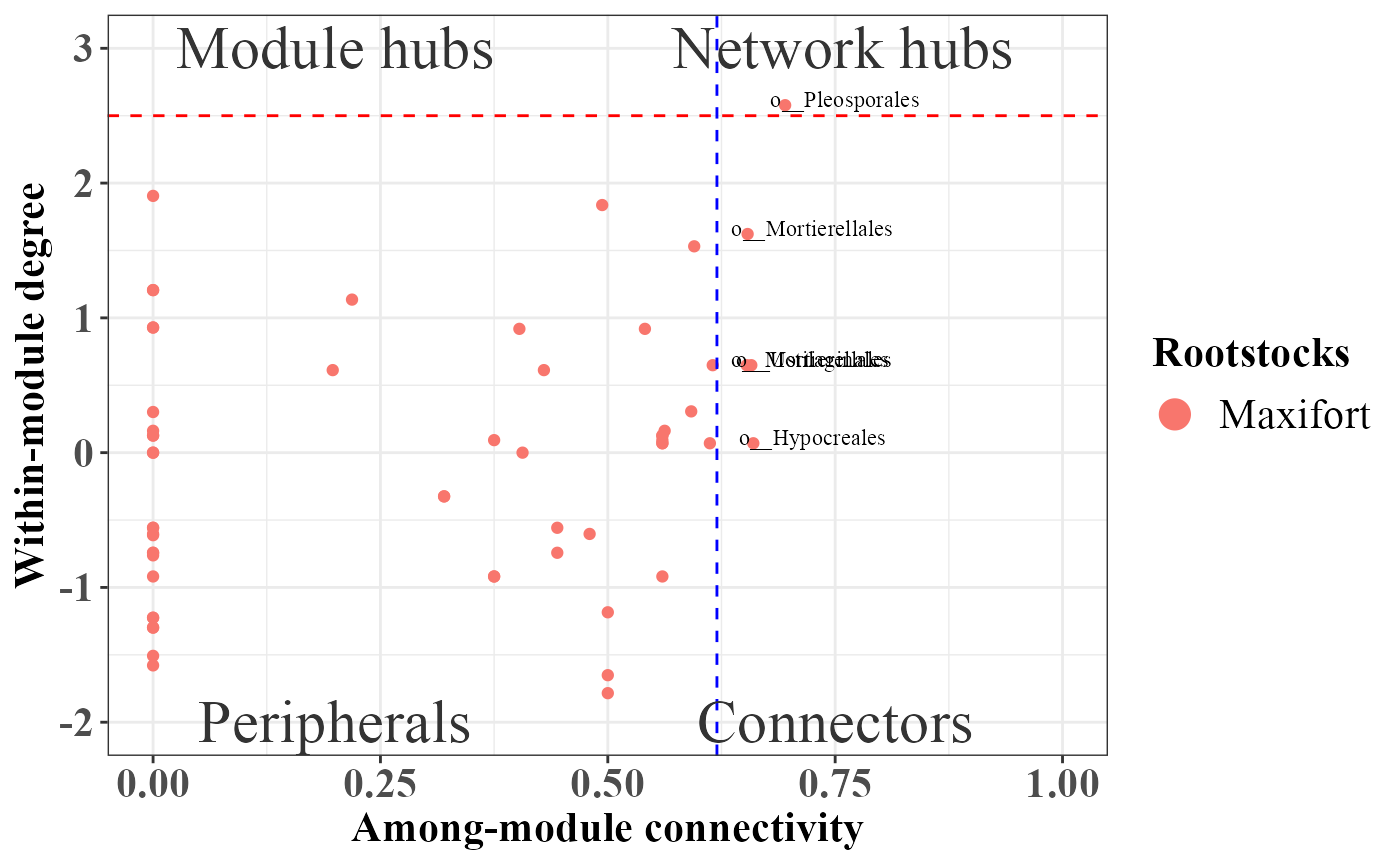
Role analyses using SA algorithm implemented in rnetcarto package.
rolePlot(example_lm)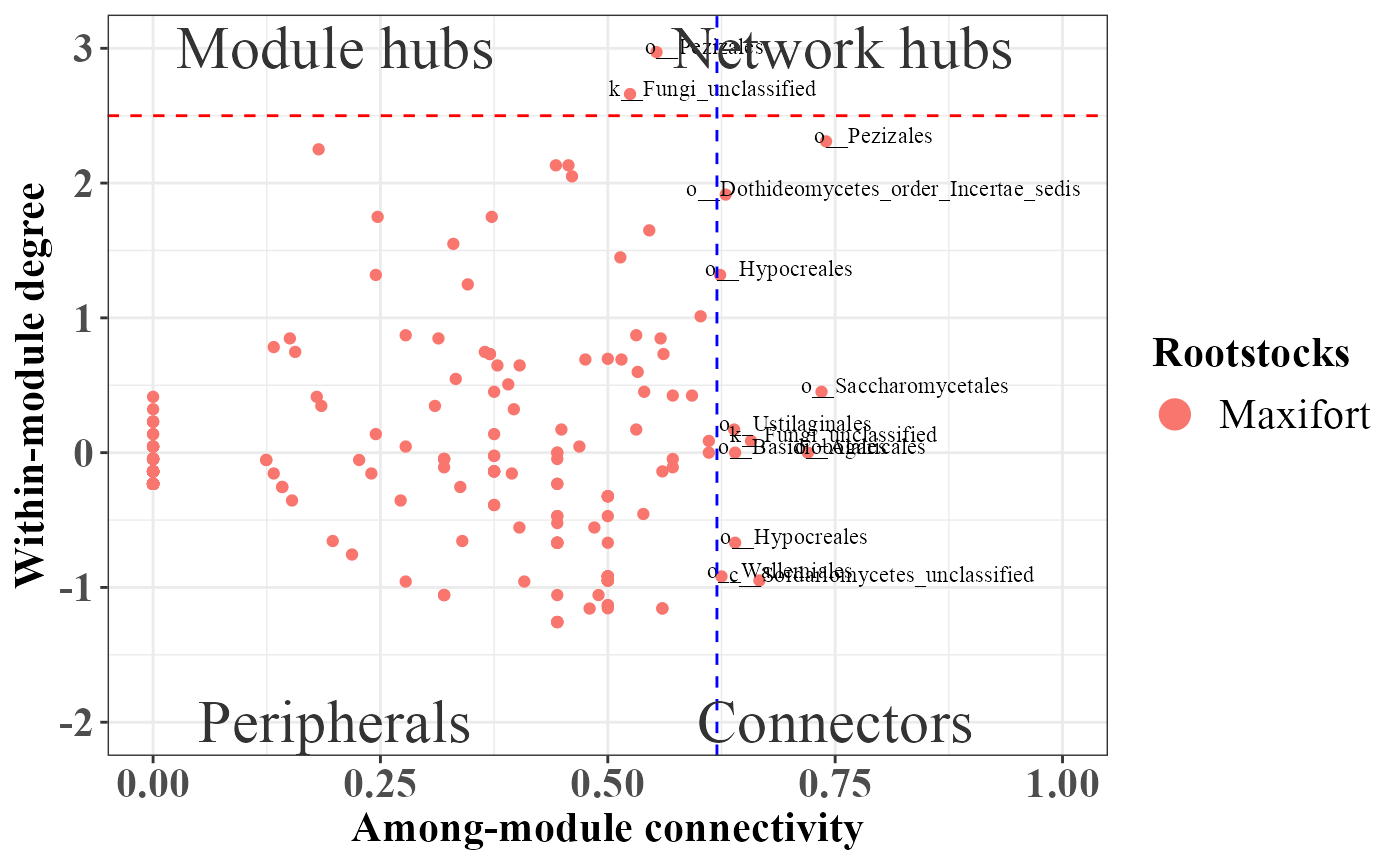
library(PhONA)
example_lasso <- PhONA(
  physeqobj = phyobj,
  cordata = sparcc.cor,
  pdata = sparcc.pval,
  model = "lasso",
  iters=2,
  OTU_OTU_pvalue = 0.001,
  OTU_OTU_rvalue = 0.6,
  OTU_Phenotype_pvalue = 0.6,
  definePhenotype = "Marketable",
  defineTreatment = "Maxifort",
  PhenoNodecolor = "yellow",
  PhenoNodesize = 20,
  PhenoNodelabel = "Yield",
  nodesize = 10,
  Pheno2OTUedgecolor = "black",
  netlayout = layout.fruchterman.reingold
)
## Total number of iterations used: 2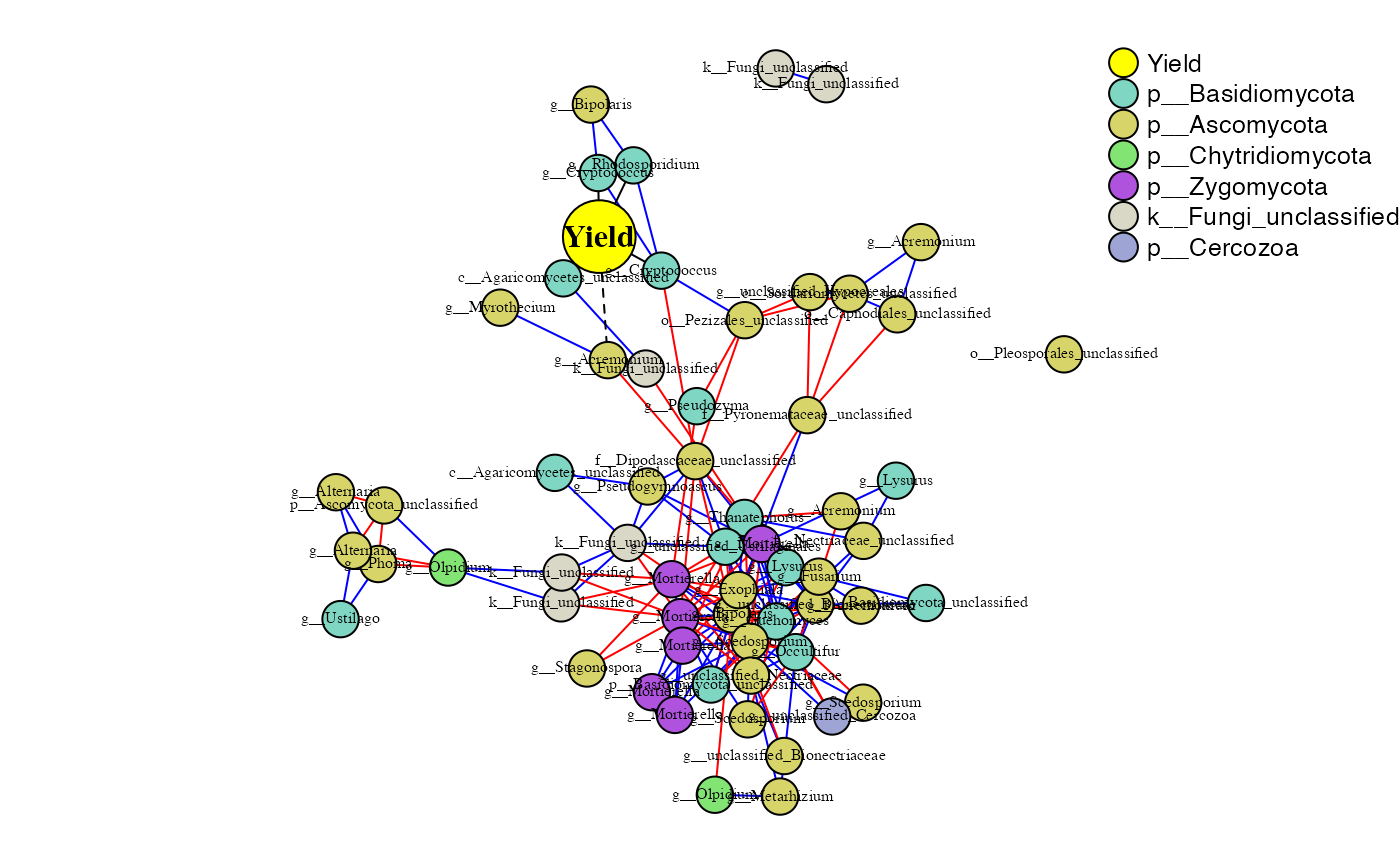
Summary of the graph
kable(summarizePhONA(example_lasso$phona_graph, example_lasso$roles))| node | edge | nodeDegree | avgpath | trans | mod | connectance | wtc | nModules.SA | top3hub | top3hubv | n_postiveL | n_negativeL |
|---|---|---|---|---|---|---|---|---|---|---|---|---|
| 61 | 181 | 2.967 | 3.108 | 0.601 | 0.364 | 0.049 | 8 | 7 | 38;23;24 | 1;0.932;0.897 | 107 | 69 |
rolePlot(example_lasso)